-cop23")
-cop2y")
")
")
")
")
Jeeyar Integrative Medical Services (JIMS) Homoeopathic Medical College and Hospital is an academic center driven by pursuit excellence in Homoeopathy. It is founded on unfathomable belief of Integrated Holistic Care in patient care and education. JIMS believes in equality through equal opportunity for wellbeing of all; the patients, students, and the community it serves.
LATEST UPDATES
Our Story
BHMS Brochure
To know more about JIMS institution and hospital Click Here


Recent Videos
")
")
")
")
")
")
")
")
")
JIMS Infrastructure
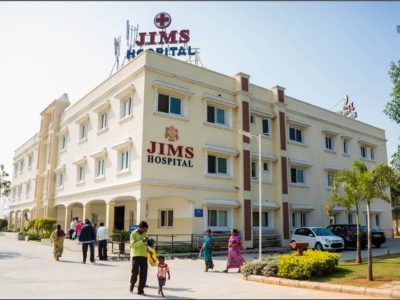
JIMS Hospital
JIMS, a not for profit organization operates on a patient centric integrative model providing comprehensive primary care at affordable cost.
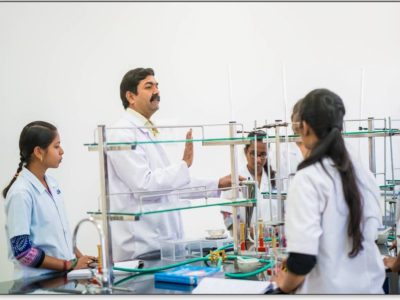
JIMS Homoeopathic Medical College
JIMS Homoeopathic Medical College, established in the year 2015 has an intake capacity of 100 students every year for BHMS course.
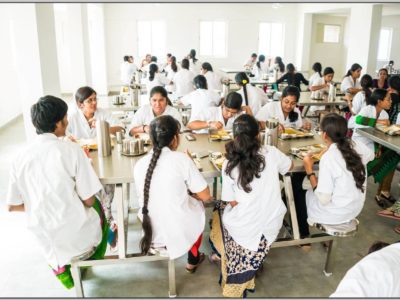
JIMS Hostel
JIMS offers hostel for resident scholars. Hostel accommodations are for comfort living offering self-content bed, bath, working space and storage.
OUTREACH PROGRAMS
As a part of PALLE-PRAGATHI PROGRAM, with the request of Gram Sarpanch and program officer, On July 9 th 2021, MEGA- HEALTH CAMP conducted at one of our adopted village Gummudavelli, Kandukur mandal.
The health camp featured general health check up, basic lab investigations along with distribution of homoeopathic medicines for various illnesses.
The camp also created awareness regarding COVID-19 pandemic and distributed COVID-19 precaution kit which contains a N95 mask, 3 ply masks and a sanitizer.
The total numbers of beneficiaries were 130.
Doctors, Interns, MSW and non medical staff were part of the camp.


Testimonials
“I am amazed to see the clean and excellent OPD and IPD setting of Homoeopathy with Integrative services of other systems. This model can be replicated in other Teaching Colleges. Keep it Up! “
— Dr. Manchanda, Director General, CCRH, Govt. Of India
I am very happy to be associated with JIMS. It is a very prestigious institute as long as the blessings of Sri Jeeyar Swamy and the guidance of Sri J.Rameswar Rao garu this institute will go on. I personally believe with this institution, homoeopathic system will get much more popularity.
— Dr.A.Rajender Reddy – Addl. Director (Homoeopathic), Dept. of Ayush. Telangana
” State of the art institute with dedicated , dynamic team with underlying spiritual vibration. This will become one of the torch bearer institute of homoeopathy.”
— Dr. Praful Barvalia , Spandan Holistic Institute, Mumbai visited JIMS on 28.08.2017.
“ It was a great experience to visit the state of art facility. I am impressed with the upkeep of the hospital. I am confident that this hospital will not only serve the needy of the area but also inspire several such humanitarian initiatives”
— Mr. S P Singh, Chief Secretary PRVRD Govt of Telangana visited JIMS on 7th July 2016.
“This is state of the art facility in a rural setting. Poor people have the services from the hospital backed up by dedicated doctors. I am inspired with the Director who spends her life for the service of the people. I convey my appreciation for the blind school, Vedic school and the trust. I wish all the best to the doctors and the staff.”
— Mr. V K Singh IPS, DG, Prisons Telangana visited JIMS on 7th of January 2017.
“Thank you for inviting me to the wonderful place, which is an inspiration not only for homoeopathy but also for our common humanity”
— Dr. Robert Van Haselen from France visited JIMS on 21.08.17
“Thank you for inviting me to the wonderful place, which is an inspiration not only for homoeopathy but also for our common humanity”
— Dr.A.Rajender Reddy – Addl. Director (Homoeopathic), Dept. of Ayush. Telangana
” State of the art institute with dedicated , dynamic team with underlying spiritual vibration. This will become one of the torch bearer institute of homoeopathy. “
— Dr. Praful Barvalia , Spandan Holistic Institute, Mumbai visited JIMS on 28.08.2017
“ Congratulations for your excellent work and thank you for being so kind with me!”
— Mr. Gustavo Cataldi , Director Escuela Médica Homeopática ,Argentina visited JIMS on the 13th of April 2016.
“ You are doing an amazing work at very low cost for the needy people. This is one of the cleanest hospitals I have seen including the hospitals in Canada. I am humbled by your dedication.”
— Dr. Kishore Malpure, Vancouver, Canada visited JIMS on 13th August 2016.
” I greatly appreciate your efforts to be an integrated hospital striving to give utmost quality care to all your patients. I look forward to seeing you and you are adopting baby friendly principles and every baby friendly standard operating practices in the labour rooms. Yo can be a champion for all hospitals to follow!!”
— Meita Rusdia UNICEF, Chief field officer, Telangana , AP & Karnataka visited JIMS on 02.09.17.
“It is a wonderful experience to see such a homoeopathy hospital . About 5 years and it will be famous as Global Institute.”
— Dr. B S Mohan, Director Institute of Practising homoeopathy (IPH)
Address
Jeeyar Integrative Medical Services (JIMS) Homoeopathic Medical College,
58PG+9GJ, Venkannaguda, Telangana, 509325.
Telephone
+91 8333981548, 040-23470300 , 7330984930
Fax: 040-23470444
contact@jimshomeocollege.com